LogoLogo
Book a demoLog in
  • Swarmia documentation
  • Getting started
    • Get started in 15 minutes
    • Integrations
      • GitHub
        • GitHub Enterprise Server
        • Multiple GitHub organizations
        • Forked repositories
        • Troubleshooting
          • Reinstalling the Swarmia GitHub app
          • Updating app permissions
          • Installing Swarmia outside of GitHub Marketplace
      • Jira
        • Jira Server and Jira Data Center
        • Jira best practices
        • Multiple Jira organizations
      • Linear
        • Private Linear teams
        • Disconnect Linear
      • Slack
        • Private Slack channels
      • Authentication
        • Google Single Sign-On
          • Frequently asked questions
        • Okta Single Sign-On
      • HR systems
      • Data export
        • Data cloud
        • Export data as a CSV file
      • Other integrations
        • Other issue tracker integrations
        • Other source code hosting integrations
  • Configuration
    • Creating & managing teams
      • Teams API
    • Managing users and roles
    • Organization settings
      • Jira setup
      • Data quality
        • Pull request data quality
        • Linking pull requests to issues
      • Investment balance
      • Deployments
        • Generate deployments from merged pull requests
        • Generate deployments from GitHub deployments
        • Generate deployments from GitHub checks
        • Generate deployments via the API
          • Generate deployments for monorepos via the API
    • Team settings
      • Mapping work to your team
      • Sprints
      • Team notifications
    • Notifications
      • Personal notifications
  • Use cases
    • Improve pull request flow
      • Pull request insights
      • Reducing pull request cycle time
      • Review code faster
      • Managing pull requests in progress with the Pull Request view
      • Diagnosing low pull request throughput
      • Analyzing pull request batch size
  • Improve your team's focus
    • Optimizing issue cycle time
    • Analyzing activity patterns on Work Log
    • Grouping activity on the Work Log view
    • Retrospective guide
  • Balance engineering investments
    • Activity and effort-based models
    • Categorizing work
    • Common problems with balancing engineering investment
  • Deliver strategic initiatives
    • Forecasting initiatives
  • Capitalize software development costs
  • Run developer experience surveys
    • Creating a survey
    • Managing surveys
    • Viewing and sharing survey results
    • How we show your survey responses
    • Survey communication guide and templates
  • Track DORA metrics
    • Automatic change failure detection
    • How Swarmia links PRs to deployments
  • Coach software developers
  • Get visibility into your CI pipeline
  • Working agreements
    • Set up working agreements
  • Metrics & definitions
    • Pull request cycle time
      • What's the difference between "Change lead time" and "Pull request cycle time" metrics in Swarmia?
    • Issue cycle time
      • Defining issue lifecycle and cycle time
    • Developer effort (FTEs)
  • DORA metrics
    • Change lead time
    • Deployment frequency
    • Mean time to recovery
    • Change failure rate
  • Throughput
  • Time to deploy
  • Batch size
  • Flow efficiency
  • Scope creep
  • Frequently asked questions
    • How do you treat weekends in metrics?
    • Tracking squashed commits
    • How do merge queues affect my metrics?
    • Why is my commit not visible in Swarmia?
    • How do I account for people leaving my organization?
  • Resources
    • Security & data retention
      • Data security
      • Data access
      • Swarmia IP Addresses
      • Single Sign-On (SSO) / SAML
      • Can I get a copy of the SOC 2 Type II audit report?
      • Deleting your organization
  • Pricing & plans
    • Compare plans
    • Free plan
    • Do I need a credit card to start a free trial?
    • What are the differences between the individual modules and the standard plan?
    • How do you determine the number of developers for billing?
    • What happens to customers with the Lite plan after the December 2024 pricing and plan change?
  • Changelog
On this page

Was this helpful?

  1. Use cases
  2. Improve pull request flow

Pull request insights

Diagnose cycle time issues, decrease review time and improve pull request workflow with Swarmia's pull request insights.

PreviousImprove pull request flowNextReducing pull request cycle time

Last updated 1 month ago

Was this helpful?

Getting high-quality data about your pull request workflow is the first step to a better understanding of process changes that improve velocity and quality — and our are here to help. Here are some highlights to get started:
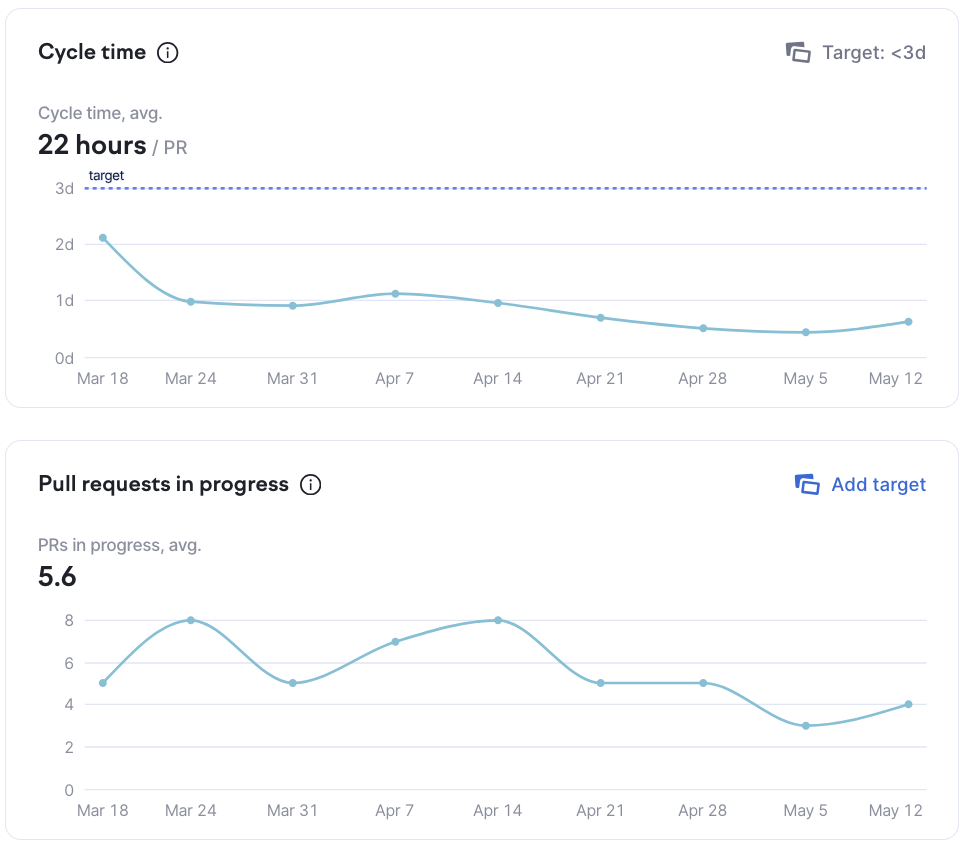
Cycle time average graph (on the right) shows how long it generally takes you to close pull requests, and how the situation develops over time. If you close pull requests timely, it trends down. Pull requests left open for several days result in an upwards trend. Aiming to close all pull requests in under a week (or 1–2 days on average) is a good starting point for continuous delivery. Now let's look into what contributes to cycle time.

Cycle time is influenced by many factors. Pull requests in progress graph (on the left) gives a clue into how your ability to close pull requests is affected by the number of pull requests worked on at once by the team. Working on too many pull requests at once can result in longer delivery times, and we recommend adding a to make sure pull requests don't pile up slowing the team down.
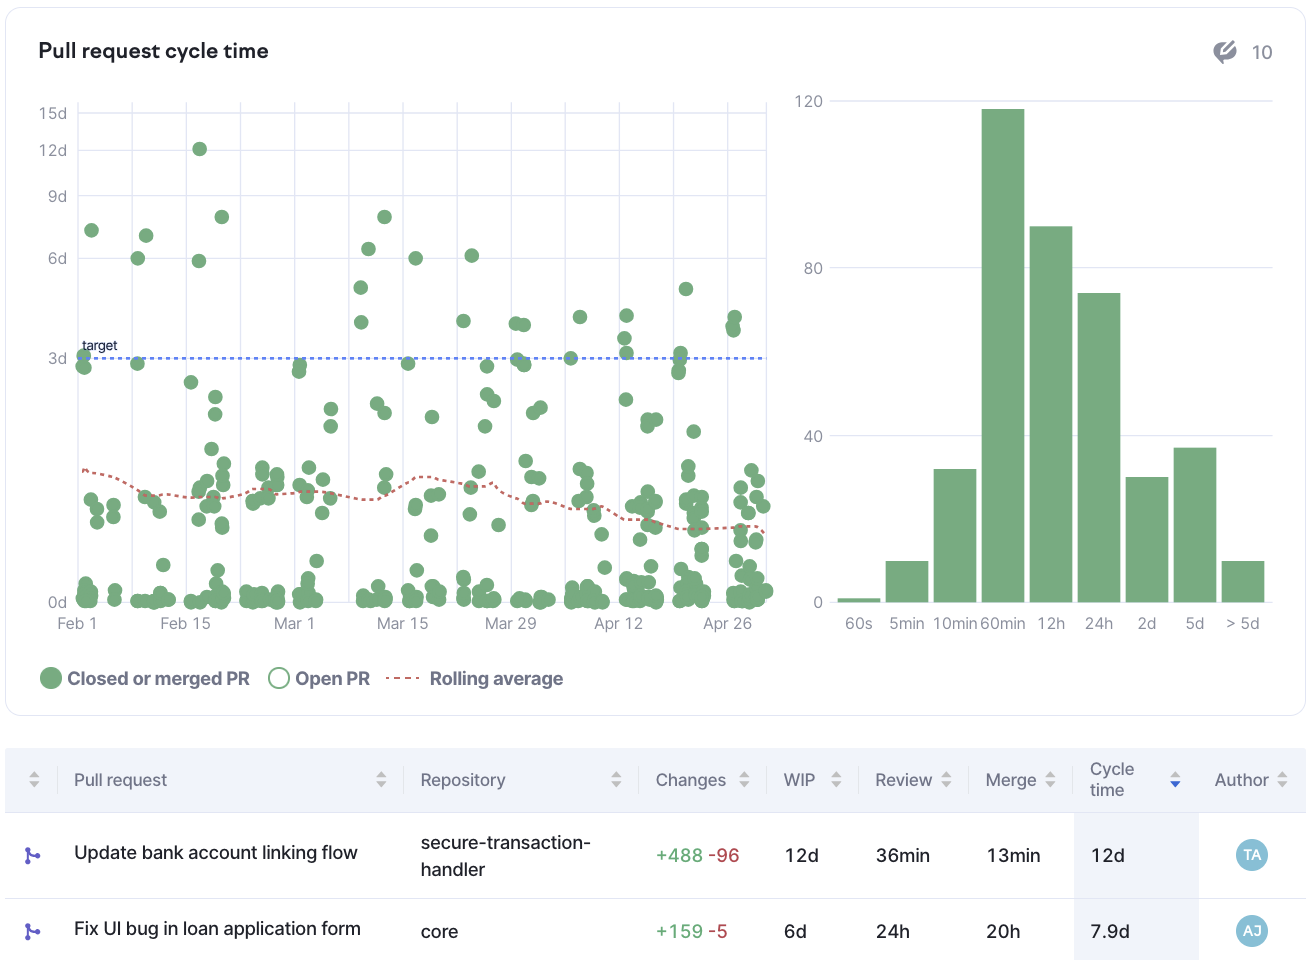
Cycle time distribution chart (on the right) shows what portion of pull requests takes longer than expected to complete, and individual pull requests are shown in the scatter plot on the left. Pull requests far above the rolling average line need special attention — it's the code that's been waiting for the longest to be delivered.
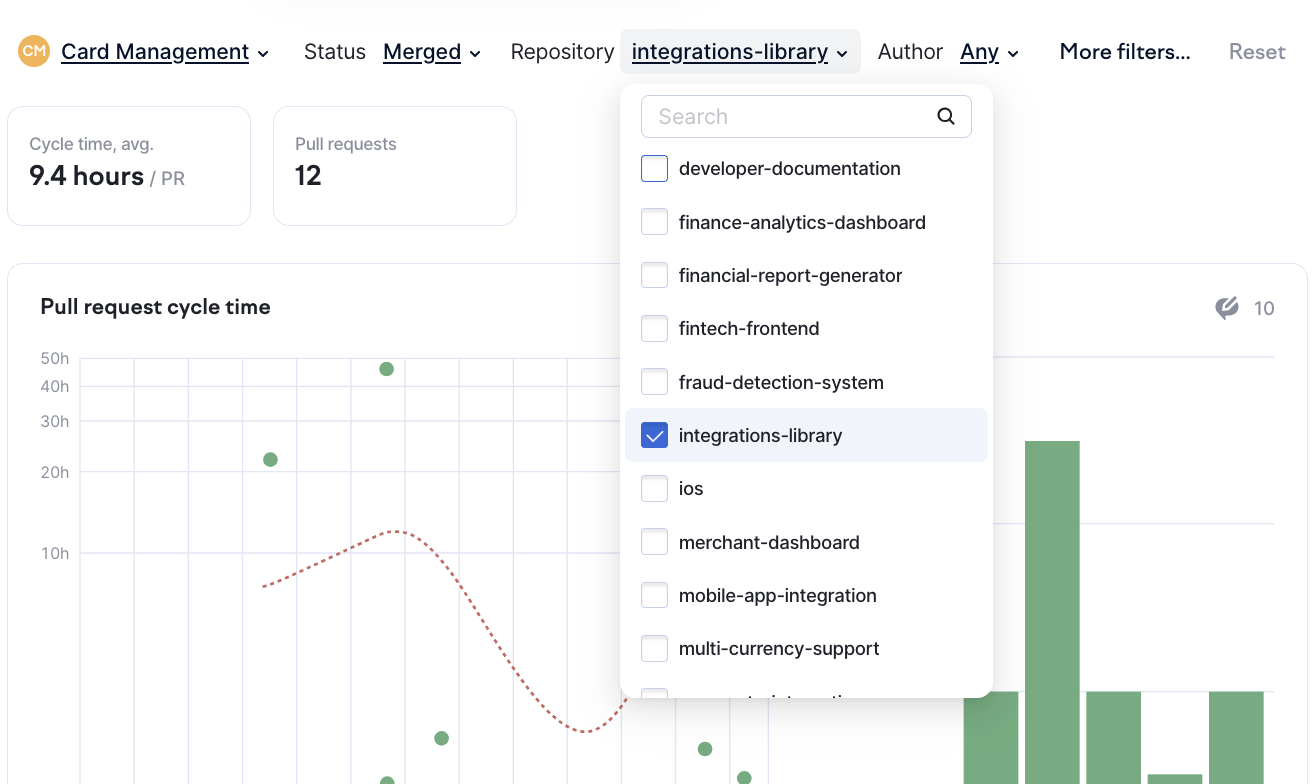
Filter the pull request table by status, repository, or author (by clicking the filter icon in the table header) to identify problematic pull requests. Filters are applied to the table as well as the charts above it.
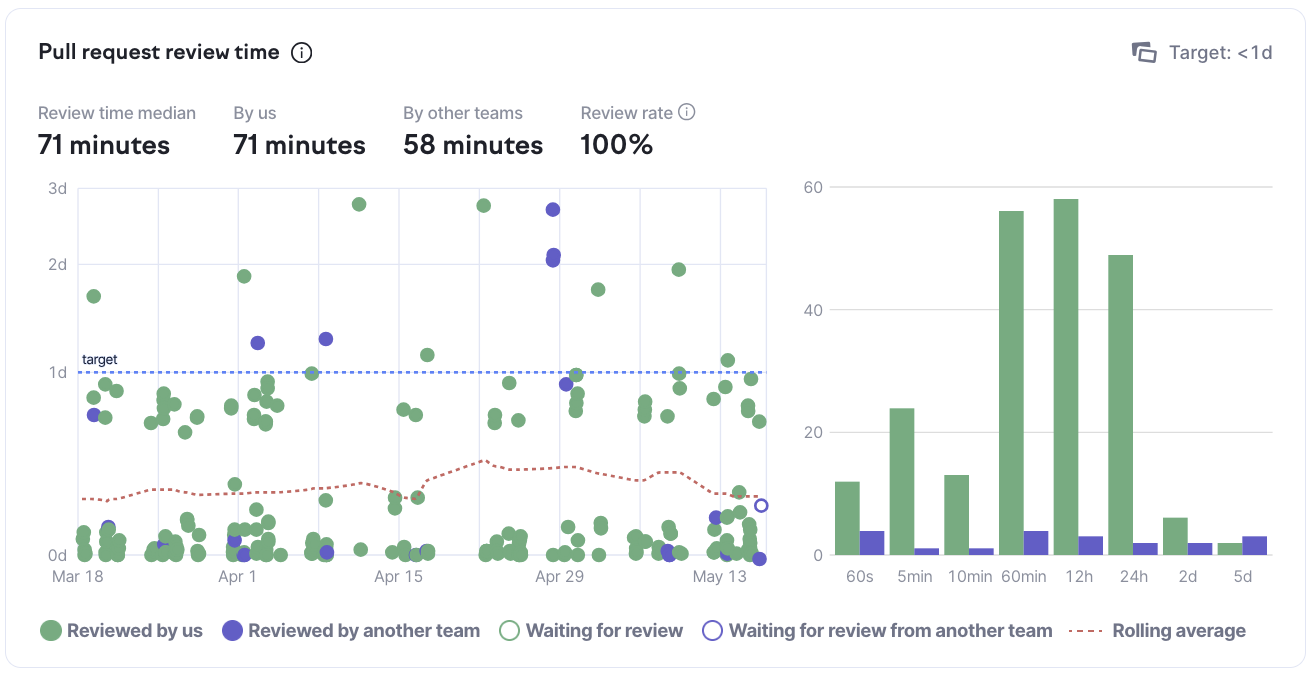
Review time is another important contributing factor to cycle time. Sorting the table by review time helps to identify pull requests that spent the longest in review — or were merged without review at all. The number of pull requests merged without review is reflected in the review rate above the chart.

— Work in progress limit for pull requests (e.g. we don't leave more than 10 pull requests open at once) — Cycle time target (e.g. closing pull requests in under 7 days) — Review time limit (e.g. reviewing pull requests in under 48 hours)

Once you've identified patterns in your pull request workflow, consider discussing the following with the team:

working agreements
pull request insights
work in progress limit