> For the complete documentation index, see [llms.txt](https://help.swarmia.com/llms.txt). Markdown versions of documentation pages are available by appending `.md` to page URLs; this page is available as [Markdown](https://help.swarmia.com/features/forecast.md).

# Forecast

A single completion date is a guess. The forecast gives you a range instead. It runs a Monte Carlo simulation over how much effort your team's past work actually took, then projects how much effort is left on a parent issue or initiative and when it's likely to be done.

You get two answers:

* **Remaining effort**, in [full-time equivalents](/definitions/developer-effort-ftes.md) (FTE), so you can see how big the rest of the work is.
* **Completion dates** at three confidence levels, so you can plan around how likely each date is rather than betting on one.

## Why a simulation

Real work is uneven. Some tasks take an afternoon, others drag on for weeks, and the people doing them aren't always working at full capacity. A simple "average task time × tasks left" estimate hides all of that variation and tends to be optimistic.

Instead, Swarmia looks at how much effort each piece of recent work actually took and recombines those real outcomes across thousands of simulated scenarios. Each scenario draws a different mix of fast and slow tasks, so the result is a spread of possible futures. The dates you see are read off that spread.

## Where to find it

The forecast lives on the overview of a parent issue or an initiative:

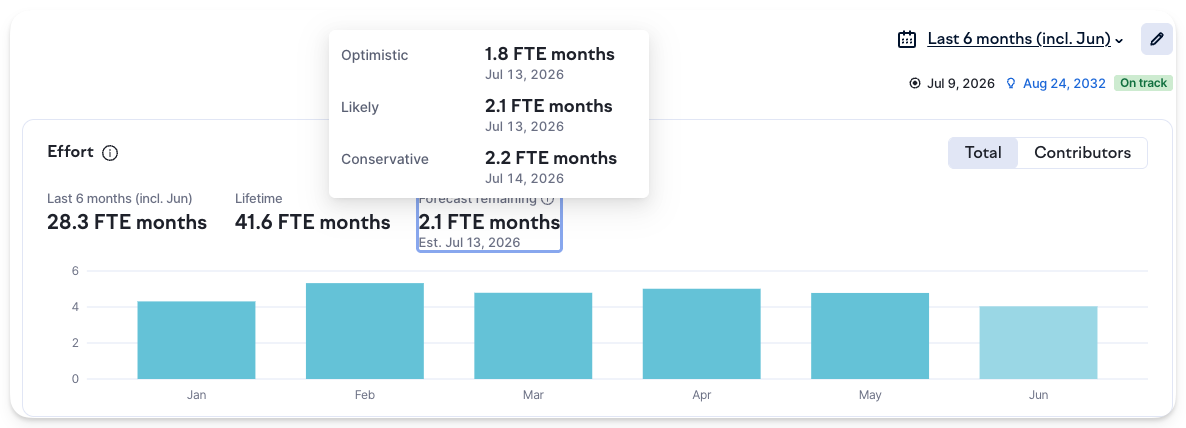
* The **Forecast remaining** panel shows the remaining effort and the projected completion date at a glance.
* The **Forecast** button opens the full view, where you can read every confidence level and adjust the assumptions behind the forecast.

<figure><img src="/files/KCbPexgHTwk3vqBDas0e" alt="Forecast remaining panel with a tooltip breaking down the optimistic, likely, and conservative estimates"><figcaption><p>The Forecast remaining panel shows the leftover effort and projected date, and breaks down the confidence levels on hover</p></figcaption></figure>

## Reading the forecast

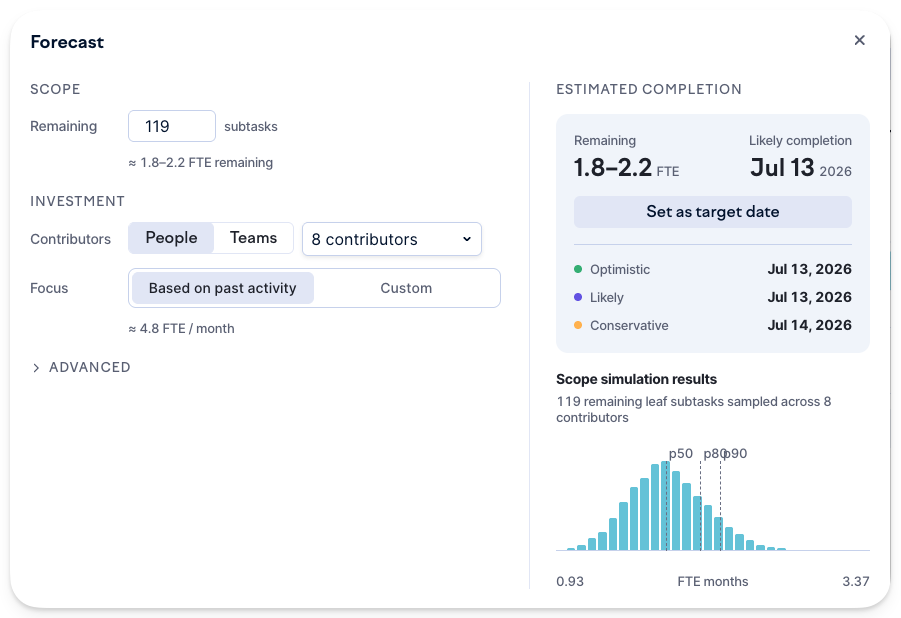
The forecast view has two halves: the assumptions on the left and the results on the right under **Estimated completion**.

<figure><img src="/files/HhG46vHBoITEIQTTssbb" alt="The Forecast view with scope and investment inputs on the left and estimated completion dates plus the simulated distribution on the right"><figcaption><p>The Forecast view: your assumptions on the left, the estimated completion and simulated distribution on the right</p></figcaption></figure>

* **Remaining** shows the leftover effort as an FTE range, from optimistic to conservative. For example, 1.8–2.2 FTE means the rest of the work is worth roughly two months of one full-time engineer.
* **Likely completion** is the headline date, the one most scenarios land on or before.
* The three confidence levels below it show how the date shifts with certainty:

| Level            | Confidence | What it means                                                                          |
| ---------------- | ---------- | -------------------------------------------------------------------------------------- |
| **Optimistic**   | 50%        | Half of the simulated scenarios finished by this date. A best case, not a plan.        |
| **Likely**       | 80%        | Four out of five scenarios finished by this date. The date to plan around.             |
| **Conservative** | 90%        | Nine out of ten scenarios finished by this date. A safer date to commit to externally. |

Later dates carry more certainty, so the gap between optimistic and conservative tells you how predictable the work is. A wide gap means the past effort varied a lot and the finish date is hard to pin down. A narrow gap means the work has been steady.

**Scope simulation results** plots the full distribution of remaining effort, so you can see the most common outcomes and how long the tail of slower scenarios runs.

## Adjusting the forecast

The forecast starts from sensible defaults, but you can change any assumption to test a scenario. Nothing you change here is saved to the issue or initiative.

* **Scope → Remaining** is the number of open subtasks left to complete, counting the lowest-level tasks only. Override it to model adding or cutting work.
* **Investment → Contributors** is who's doing the work. Switch between **People** and **Teams** to pick individuals or whole teams. The forecast draws on these contributors' own past effort, both to size the remaining work and to pace it, so changing who's selected shifts the result even when the scope stays the same.
* **Focus** controls that pace. **Based on past activity** uses each contributor's recent monthly effort. Switch to **Custom** to set a percentage of capacity, for example 60% if the team is splitting attention with other work.
* **Advanced → Sample data** is the window of history the simulation draws from, six months by default. Widen it for a longer-running team, or narrow it if recent work is more representative of what's ahead.

On an initiative, you can select **Set as target date** to set the initiative's target to the likely completion date. This is available if your role lets you [manage initiatives](/settings/organization/managing-users-and-roles.md).

## What good looks like

* **Plan around the likely (80%) date, commit externally to the conservative (90%) one.** The optimistic date is a best case, useful for spotting upside but risky to promise.
* **Watch the spread, not just the date.** A wide gap between optimistic and conservative is a signal that the work is unpredictable. That's worth a conversation before it's worth a deadline.
* **Re-run it as work lands.** The forecast updates as tasks close and effort accrues, so a date that keeps slipping points to scope growth or a drop in focus, both of which you can see by adjusting the inputs.

## Requirements and limitations

* The forecast needs **recent effort history** from the selected contributors. With no history in the sample window, there's nothing to simulate and no date can be projected.
* It counts **leaf subtasks only**, the lowest-level issues with no children. Parent issues don't add to the remaining count.
* **Review-only participation isn't counted** toward the pace. A contributor who only reviews code doesn't move the burn rate.
* If the remaining effort outpaces the team's investment, the forecast shows **10+ years** rather than a date. That usually means too few contributors, too little focus, or not enough history to go on, not a literal decade.
* Completion dates assume **no weekend work**, so a date landing on a weekend moves to the following Monday.
* The forecast is available for **all types of in-progress initiatives and in-progress parent issues**.

## Frequently asked questions

### Why does the forecast change when I select different contributors?

The simulation draws on the selected contributors' own past effort, so who you pick shapes the result even when the number of subtasks stays the same. Their typical effort per task sets the size of the remaining work, and their recent monthly pace sets how quickly it gets done. Selecting more contributors, or ones who've been more active, raises the projected pace and pulls the date earlier.

### What counts as remaining work?

Open leaf subtasks, the lowest-level issues that aren't yet done. You can override the count under **Scope** to test what adding or removing work does to the forecast.


---

# Agent Instructions
This documentation is published with GitBook. GitBook is the documentation platform designed so that both humans and AI agents can read, navigate, and reason over technical content effectively. Learn more at gitbook.com.

## Querying This Documentation
If you need additional information that is not directly available in this page, you can query the documentation dynamically by asking a question.

Perform an HTTP GET request on the current page URL with the `ask` query parameter, and the optional `goal` query parameter:

```
GET https://help.swarmia.com/features/forecast.md?ask=<question>&goal=<endgoal>
```

`ask` is the immediate question: it should be specific, self-contained, and written in natural language.
`goal` is optional and describes the broader end goal you are ultimately trying to accomplish on behalf of the user. GitBook uses it to tailor the answer towards what is most useful for that goal.

The response will contain a direct answer to the question and relevant excerpts and sources from the documentation.

Use this mechanism when the answer is not explicitly present in the current page, you need clarification or additional context, or you want to retrieve related documentation sections.